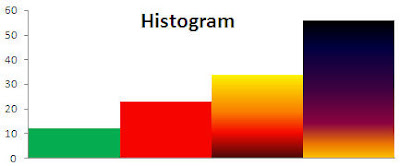
Histogram is a simple column chart but there are no gaps between columns. In Excel and Word it's quite uneasy to find how to make a histogram. In Help there is only 3 results which show something related to histograms and not really helpfull.
- To start making histogram fill all cells with needed data in excel worksheet.

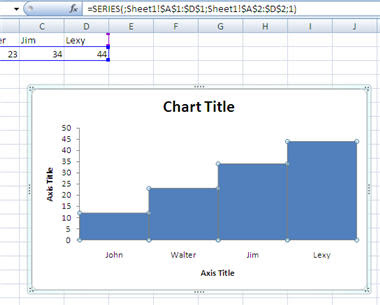
- Highlight all data and select insert->colum->clustered column as shown in the screenshot.

A simple clustered column charts appears.
You can make it look like a histogram by going to design tab and Chart Layouts. Select layout style no. 8 and see how diagram changes into histogram looking chart.

The same procedure goes with Word. You can copy diagram in Word from Excel.


7 comments:
are you stupid?
a histogram is a chart of relative frequencies for specified bins.
what you have made is not a histogram.
me again,,, ive figures a tacky way of doing it:
1. have your data in a row A1:A30
2. construct the following table:
0 5 1
5 10 2
15 20 3
etc you get the idea right?
say your table is in "d24:f32"
3. use =VLOOKUP() to determine what bun a data point belongs to. put that undearneath each datapoint
4.use =IF(A$2=$f24,1,0) and expand this to the right and down to cover all datapoints and all bins.
5. count the number of ones in each row. that;s gonna give you the frequency per bin.
if you find easier way please post.
thanks...
THANK YOU SO MUCH!
:)
MY 8th THING IS DIFFERENT AND I DONT HAVE THAT ONE
OMIGSH...............that is soo not how you make a histogram
first of all thats not even a histogram i know how to do it PROPERLY but its too long to explain:D:P
Try downloading a template from www.excelhistograms.com
Its easy to use :)
Post a Comment